|
Companies that are large enough to be organized into strategic business units face the challenge of allocating resources among those units. In the early 1970's the Boston Consulting Group developed a model for managing a portfolio of different business units (or major product lines). The BCG growth-share matrix displays the various business units on a graph of the market growth rate vs.
market share relative to competitors:
BCG Growth-Share Matrix

Resources are allocated to business units according to where they are situated on the grid as follows:
Cash Cow - a business unit that has a large market share in a mature, slow growing industry. Cash cows require little investment and generate cash that can be used to invest in other business units. Star - a business unit that has a large market share in a fast growing industry. Stars may generate cash, but because the market is growing rapidly they require investment to maintain their lead. If successful, a star will become a cash cow when its industry matures. Question Mark (or Problem Child) - a business unit that has a small market share in a high growth market. These business units require resources to grow market share, but whether they will succeed and become stars is unknown. Dog - a business unit that has a small market share in a mature industry. A dog may not require substantial cash, but it ties up capital that could better be deployed elsewhere. Unless a dog has some other strategic purpose, it should be liquidated if there is little prospect for it to gain market share.
The theory underlying the Boston Matrix is the Product
Life Cycle concept (below), which states that business
opportunities moves through 'life-cycle'
phases of introduction, growth, maturity and decline.
These phases are typically represented by an
anti-clockwise movement around the Boston Matrix quadrants
in the following order:
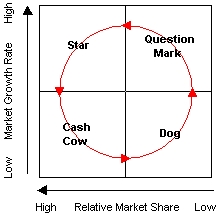 >
From a market entry position as a 'Question
Mark' product. Products are usually launched into high
growth markets, but suffer from a low market share. >
From a market entry position as a 'Question
Mark' product. Products are usually launched into high
growth markets, but suffer from a low market share.
> To a 'Star' position as sales and
market share are increased. If the investment necessary to
build sales and market share is successfully made, then
the product’s position will move towards the star position
of high growth / high market share.
> To a 'Cash-Cow' position as the
market growth rate slows and market leadership is
achieved. As the impact of the product life cycle takes
effect and the market growth rate slows the product will
move from the star position of high growth to the Cash Cow
position of low growth / high share.
> Finally to a 'Dog' position as
investment is minimised as the product ages and loses
market share.
At each position within the matrix there are a number of
opportunities ‘open’ to the company. For example, at the
Cash-Cow stage the options are either to invest to
maintain market share, or to minimise investment in the
product, maximise the cash returns and grow market
dominance with other products.
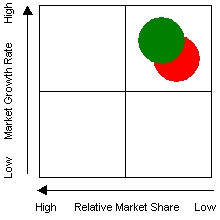
Question Mark Products
It is much more common for new products to be launched
into high rather than low growth markets, as the
perception is that high growth markets will eventually
generate a greater return. However the drain on cash at
this stage can be great. Initially the volume of product
sold will be low and significant marketing expenditure
will be required to raise market awareness and stimulate
volume sales. If the corporate objective of building sales
to achieve market leadership is pursued, then the
combination of high market growth rates and high
promotional expenses will create a large demand for cash.
Moreover, the technology involved in production may also
be at the growth phase of its life cycle. This results in
a proliferation of product types, step jumps in terms of
quality (compared with previous generations of the same
utility) and presence in the market only for a relatively
short period of time. All of this requires a significant
investment to fund the continuous development programme
and (quite probably) an expensive manufacturing operation.
If the initial investment decisions were sound, and sales
follow on at a faster rate than for other competing
products, the product will move into the 'Star' category
as increases in relative market share are achieved. If
such investments are not made, then the product will at
best maintain a static market position and in time, lose
market position to other competitive products. Its
ultimate demise will be into the 'Dog' category.
The two extremes of strategy available for managing
'Question Marks' are:
To make
the major investment decision, gain a disproportionate
share of new sales, or achieve sales by acquiring
competitor’s products. The objective is to turn the
‘Question Mark’ into a 'Star'. To divest
and exit from the opportunity if the stakes are too
high.
The adoption of a segmentation strategy – i.e. use more
limited resource and focus in on key market niches in
which one can play a leading role – may be an alternative
and lower risk strategy.
Star Products
'Stars' are successful products for which there is
significant market demand. Usually they have grown from
'Question Marks' by gaining a high relative market share.
They may be approaching the mature phase of their life
Like 'Cash Cows', 'Stars' are in market leading positions;
unlike 'Cash Cows', 'Stars' must have sales which continue
to grow at a high rate in order to maintain their market
positions. Whilst 'Stars' will yield a significant
cashflow to the business, they will also require high
levels of cash injection to finance growing sales. 'Stars'
are therefore prime candidates for investment.
Sustaining high sales growth requires that new users for
the product be found as well as penetrating further into
existing markets. Therefore the appropriate strategies for
'Stars' are those which protect existing market share and
result in increased volume supply into the market, e.g.
product enhancements, improved distribution, cost
efficiencies etc.
When the market growth rate slows, 'Stars' should become
the business’s 'Cash Cow' products.
Desirable
market position where brand and product image and market
position are also strong.
Coincident with positive gradient phase of the market
life cycle. If high
market growth rate continues, cash investment would
probably be required to maintain or increase cash
dominance.
Cash-Cow Products
'Cash Cows' are well established and are likely to be in
the mature phase of their life cycle. These products are
well entrenched and sales will have grown to a stable
maximum level. Generally 'Cash Cows' are very profitable
and by the time they are classified as such they will be
making a major positive contribution to the company’s
cashflow.
Investment in product development resulting in the launch
of product variants (causing brand proliferation), or any
effort toward market extension, should be avoided unless
there is opportunity for a very good return. Instead, the
surplus cash generated from 'Cash Cows' should be used for
investment in newer products associated with higher growth
markets.
Pricing and promotional strategies appropriate to ‘Cash
Cow’ products should be aimed at maintaining their hard
won market share. Attempting to increase market share when
all the competing players are entrenched may prove to be a
costly and unsuccessful strategy. Unless there are good
reasons for doing otherwise, the maximum investment limit
in 'Cash Cows' should be sufficient only to maintain their
market position.
The market growth rates for ‘Cash Cow’ products have
slowed. The most likely potential threat to the
maintenance of stable business conditions may be the
introduction of low cost substitute products offering more
benefit to the customer. The new competing product may
utilise a different (or new) technology in its manufacture
or to function. If this new competing product is
successful, the original product’s life cycle could be
shortened, thus reducing its financial return.
Very
desirable position where brand and product image and
market position are strong
Coincident with the mature phase of the market life
cycle Should be
cash rich and generate significant cash surpluses.
Dog Products
Products sold into segments in which the company is not
one of the leaders, and in which the market is not
growing, are classified as 'Dog' products. These products
are likely to be in the mature phase of their product life
cycle. Their markets exhibit slow, static or even negative
growth. There will be little new business to compete for
and any strategic moves to increase market share are
likely to provoke vigorous competitive reaction.
'Dogs' may be linked to low profits, and the prognosis for
investment is generally low. Unless some new competitive
advantage can be introduced it is likely that these
products or businesses will not be able to compete and
will not attract the resources necessary to improve the
product’s position within the market. If future market
demand is considered likely to last for some years, then
the commercial risk of building market share may be worth
while. Generally however, alternative more attractive
investment decisions could probably be found elsewhere.
Therefore 'Dogs' should remain within the portfolio so
long as they contribute something to the business (other
than being the personal hobbyhorse of the Chairman)!
Strategists should be looking to 'Dog' products for:
If (as is often the case with Dog products) the
opportunity is moribund, decisive action should be taken
such as:
Focusing
attention and resources to other segments that will
provide a better return Focusing
attention and resources to other segments which can be
ring-fenced.
Maximising cashflow from the product by reducing to a
minimum all production and marketing costs. Disposing
of the product, selling the rights to the product or the
business. Dropping
the product from the portfolio. Generally
not a very strong or particularly desirable market
position
Strategic Implications
The importance of achieving a balanced Product / Market
portfolio cannot be underestimated, but what exactly
constitutes a winning portfolio is more difficult to
determine.
A policy of continuous product development resulting in
the steady launch of new products is essential to
corporate health. It therefore follows that a portfolio in
equilibrium will include a number of 'Question Mark' and
'Star' products, though the number of 'Question Marks'
should be greater than 'Stars' to allow for market
failures. To achieve the required balance, branded
products with strong market positions can either be
acquired or developed in-house. The frequency at which new
products should be developed will be different for each
market and industry but will be linked to:
Rate at
which competitors launch new products Market’s
history and current trends for product development
Market’s
/ Industry’s typical product life cycles. Scope for
actual or perceived product differentiation.
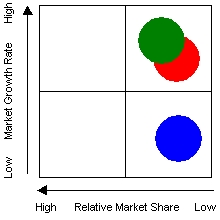
There also needs to be sufficient cash rich product to
generate a cash surplus. A healthy portfolio will have a
number of 'Cash Cow' products (minimum of two) to reduce
the obvious risks associated with the business being
dependent upon the sales of a single product. Ideally
there should be relatively few 'Dog' products.
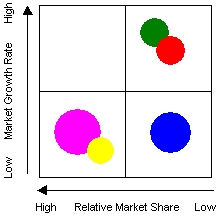
A portfolio with all of the products positioned in the
bottom of the matrix where all the company's products are
sold into low growth markets does not represent a balanced
portfolio. Although it does not represent an immediate
potential threat to the health of the business it should
be cause for concern in the medium to long term. A
preponderance of products in the lower half of the matrix
suggests the possibility of either or a combination of the
following:
Based upon the portfolio distribution it may be
possible to determine the company's overall strategic
intent as follows:
1. Hold Strategy
 To
enjoy continued strong cashflow. Relatively high market
share / low market growth rate ‘Cash Cow’ opportunities
should be able to maintain market share at or around
existing levels. To
enjoy continued strong cashflow. Relatively high market
share / low market growth rate ‘Cash Cow’ opportunities
should be able to maintain market share at or around
existing levels.
2. Build Strategy
 To
grow the business. Relatively low relative market share /
high market growth rate ‘Question Mark’ opportunities need
investment in order to grow. To
grow the business. Relatively low relative market share /
high market growth rate ‘Question Mark’ opportunities need
investment in order to grow.
3. Harvest Strategy
 To
develop short term cashflow irrespective of the long term
damaging effect to the product or business. This strategy
is appropriate for any weak products where disposal in the
form of a sale is unavailable or not preferred due to high
exit barriers. To
develop short term cashflow irrespective of the long term
damaging effect to the product or business. This strategy
is appropriate for any weak products where disposal in the
form of a sale is unavailable or not preferred due to high
exit barriers.
4. Divest Strategy
 To
change the capital of the business and allow resources to
be used elsewhere. To
change the capital of the business and allow resources to
be used elsewhere.
Criticisms of the Boston Matrix Technique.
The BCG matrix provides a framework for allocating
resources among different business units and allows one to
compare many business units at a glance. Whilst it has
stood the test of time, the Boston Matrix is not without
its critics. Attention has been drawn to the following
shortcomings of the technique:
The
Boston Matrix assumes rigid boundaries for Products and
Markets over a period of time. There is no sense of
'evolution'. It is a
guide to cash management and investment, and not to
strategy. For example no guidance is given as to what
changes must be bought about in order to achieve a lead
position in a growing market. It is not
multivariate in nature. The underlying Market Growth and
Relative Market share data takes no account of
competitive strengths and customer needs.
The link between market share and profitability is questionable since increasing market share can be very expensive.
The approach may overemphasize high growth, since it ignores the potential of declining markets.
The model considers market growth rate to be a given. In practice the firm may be able to grow the market.
These issues are addressed by the GE / McKinsey Matrix, which considers market growth rate to be only one of many factors that make an industry attractive, and which considers relative market share to be only one of many factors describing the competitive strength of the business unit.

|